Featured Topic: Math Templates for Function Machines and Input/Output Tables
In keeping with this month's focus on growing patterns, use the math templates below to help students organize data in input/output tables. Students can then analyze the data, looking for patterns. Verbalizing these patterns helps students write the pattern in words and then translate those words into mathematical notation to write a general rule for the nth term. Older students can graph the ordered pairs and analyze the graph representation of the function as well.
Classroom Management: Insert student templates into sheet protectors. Students use dry-erase markers to record information for each problem. Using student templates is an excellent strategy for increasing active participation of all students. This strategy also provides teachers with formative assessment as they circulate around the room, monitoring student progress and assisting students, as needed, on an individual or small group basis.
Overhead Transparencies: Teachers should use the same template on transparency film inserted into a sheet protector on the overhead so that students can use dry-erase markers to explain their thinking. This allows students to use dry-erase markers and erasers on the transparency, eliminating the use of overhead markers and wet wipes to clear them. Additionally, if the overhead is exactly the same template that the students are using, students can simply remove the paper from their sheet protector and insert the blank transparency template to use at the overhead to show and explain their work. This is an incredible time-saver.
Download function machine templates for student use in sheet protectors and as overhead transparencies:
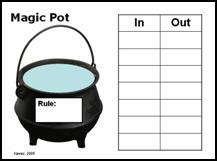
- Magic Pot and In/Out Table based on the magic pot in the Two of Everything book, is an appropriate introduction to the function machine and input/output tables when used with concrete manipulatives and a magic pot.
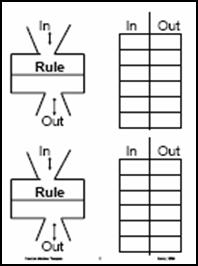
- Function Machine & Input/Output Tables encourage students to organize data and write a rule.
- Input/Output Table & Graph
- Generic 3-column Table
- See more templates in Template Library.
- See more information on Using Templates to Increase Active Participation.


Enter your email address below to receive notifications when new content is added to Mathwire.
Recent Additions to Mathwire.com
Added on 5/9/06: Open-ended Assessments
-
 Shape Sort requires students to sort a collection of shapes into 3 groups, name the groups and explain why they sorted the shapes in that way.
- Map Coloring challenges students to evaluate a student's answer to a map coloring problem and explain whether they agree or disagree and why or why not.
- See Problem Solving Resources for more open-ended assessments by grade level.
Added on 5/8/06: Math Templates
Many new templates were added to the Template Library. These templates were designed to be used in sheet protectors with dry erase markers to increase student active participation and to allow teachers to better assess student understanding throughout math lessons.
- Check out all templates in the Template Library.
- See Active Participation: Using Math Templates for a discussion of the strategies for using templates to increase student participation.
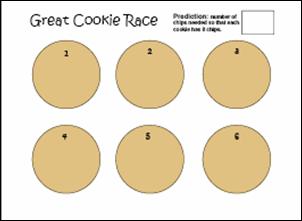
Added on 5/7/06: Great Cookie Race Game
Great Cookie Race challenges students to predict how many chips they will need to make sure each cookie has 8 chips. In this simulation, students toss a die, make a chip on that cookie and continue tossing and marking until each cookie has at least 8 chips. Students then mark their total chips on the class data chart and run another trial.
- See Data Analysis: One-Die Toss Activities for additional games and activities.
Added on 5/6/06: Data Analysis: Two-Dice Toss Activities
TWO DICE: Once students realize that the outcomes of tossing one die are equally likely, they sometimes transfer that knowledge to tossing two dice. This is a common misconception that is best addressed through data collection and analyzing that data rather than through telling. See two-dice games, suggested on this webpage, that students can play to gain experiential knowledge of the results of tossing two dice. Several of the games encourage students to develop better strategies in order to win and their growing understanding of probability will be shaped by these experiences.
After students have had several informal game-playing sessions, introduce the charting of the outcomes of throwing two dice. It is very helpful to give students two different colored dice as they ponder this problem so that they see that they can toss a 3 on the red die and a 4 on the blue die AND vice versa: a 4 on the red die and a 3 on the blue die. Both sum to 7 so they represent two DIFFERENT ways to toss a sum of seven.
- See Data Analysis: Two-Dice Toss for games, activities and handouts.
Added on 5/4/06: Data Analysis: One-Die Toss Activities
Students need many experiences tossing one die, collecting data and analyzing that data to construct meaning for the probability of the different outcomes. Since a small student sample is often skewed, it is necessary for teachers to help students collate class data to better approximate the theoretical probability that the outcomes of tossing a single die are equally likely. Try the one-die games on this page for motivating data collection opportunities that students will play again and again while generating larger data samples for class discussion. Many teachers find a simple class tally chart an effective way to organize data for this ongoing experiment. Students simply add results to the class results as they complete a game. Class discussions focus on the fairness of the games and discussion about whether each player has an equal chance of winning.
- See Data Analysis: One-Die Toss for games, activities and handouts.
Added on 5/1/06: Open-ended Assessments for Grade 3
- Animal Shelter requires students to use fractions to figure out how many cats and dogs were available for adoption at the animal shelter.
- Tadpoles and Frogs requires students to use fractions to figure out how many tadpoles and frogs there were in the tank.
- Chapter Books requires students to create a line plot, then identify the median and mode of the data.
- Carnival Tickets requires students to create a line plot, then identify the median and mode of the data.
Added on 5/1/06: Open-ended Assessments for Grade 4

- Best Deal requires students to evaluate the price of soda from three different stores to identify the best deal.
- In Cookie Box, students must figure out which box would hold more cookies.
- The Good Weather problem uses positive and negative integers in a weather setting.
- The High Number Game problem requires students to compare fractions, decimals and percents.
- The Boardwalk Fun problem requires students to use a logic grid to figure out what each kid wants to do at the boardwalk. An organized clue-by-clue solution is provided for help in using this logic grid for teachers who are not familiar with these kinds of logic problems.
- In Favorite Sports, students must complete the tally chart, create a pictograph and write about what they learned from the data.
- The Horsin' Around problem asks students to create the largest fenced-in yard for a horse, given 30 feet of fencing.
- The Going to the Dogs problem asks students to create the largest fenced-in yard for the family dogs, given 24 feet of fencing.
- Bonus Points challenges students to arrange numbers to form three-digit numbers that earn the most points in the game.
- See more Problems for Grades 3-4.
- Check out Problem Solving Resources for Grades K-8.
Added on 5/1/06: Templates
- Logic Grid - 1: a 5x5 logic grid that can be used to solve problems such as Boardwalk Fun.
- Logic Grid - 2: two 5x5 logic grids that can be used to solve problems such as Boardwalk Fun.
Mathwire Archives:

See Mathwire Archives for past issues of What's New on Mathwire.com and for past month's featured articles.