Data Analysis Investigations
Featured Topic: Data Analysis Investigations

 Where Did They Come From? is a mathematics-social studies activity that analyzes the data on the home states of U.S. Presidents. Do you know which state has given us the most Presidents? Students must analyze data in a table, construct a frequency table and graph, then finally convert this to a U.S. map colored "picture" of the data.
NCTM Illuminations: State Names requires students to analyze the frequency of letters in the names of all 50 states.
NCTM Illuminations: State Data Map allows students to use an interactive map to picture different data about the 50 states.
Students are encouraged to collect real, meaningful data, organize that data and analyze the data to draw conclusions and explain what they have learned. These investigations encourage students to apply mathematical analysis to real-life data and/or applications in order to investigate problems or issues.
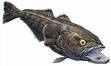
What Happened to the Patagonian Toothfish? educates students about the growing popularity of this endangered species. The activity includes a short handout that applies math to understand the problem of overfishing. Students are encouraged to use the Internet to research the problem further or to find out more about other endangered species.
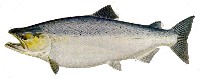
Salmon Counting, a PBS lesson plan, introduces the real-world application of tag and recapture, using mathematical sampling to estimate a population that cannot be counted.

Estimating a Snake Population, a PBS lesson plan, introduces the real-world application of tag and recapture, using mathematical sampling to estimate a snake population that cannot be counted.
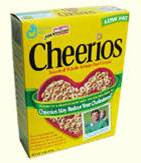
Cereal Toy Investigation uses mathematical simulation to investigate how many boxes of cereal a family would have to buy to get one of each of six toys. This activity was designed to introduce students to the world of advertising that they encounter in real life and how an understanding of probability can help form realistic expectations of "winning" each prize. Directions and student handouts are available to download for use in the classroom.
- Play Cereal Applet online for quick data collection. This Java applet was designed to complement the one-die toss classroom data collections by allowing students to collect a larger sample more quickly for better analysis of the results. Once the Java applet fully loads, click on Next Box to begin the data collection.

from the Mathwire Archives...
See more Data Analysis & Probabiity Activities including dice toss and coin flipping activities.
See Sampling Activities that introduce students to the important statistical concept of using a small sample to predict the larger population.