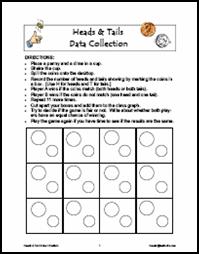
Featured Data Analysis Activity: Heads & Tails Data Collection
In this activity, students toss a penny and a dime and record whether the outcome is HH, TT, or HT and which coin is heads or tails. Students cut apart their results and add them to the class results to create a class pictograph which can be analyzed and compared to the expected outcomes. Students analyze the results to determine if the game is fair or unfair.
It is important to use two different coins so that students see that the coins matching (HH or TT) and the coins not matching (HT or TH) are equally likely outcomes. Students often respond initially that the game is unfair because the player who wins when the coins match has two chances to win while the other player only has one chance. Using two different coins and recording the results of both coins helps students dispel this initial misconception as they analyze the graph results and create a tree diagram for the event.
- Download
 Heads & Tails Data Collection
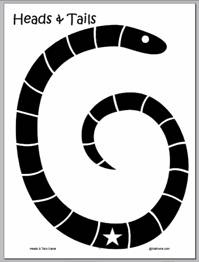

Heads & Tails Game
- Download the Heads & Tails Game: One student is heads and one student is tails. Students start their markers on the star in the middle of the snake. If the coin lands on heads, the heads person moves his/her marker one space toward the head of snake. If the coin lands on tails, the tails person moves his/her marker one space toward the tail of the snake. The first person to reach the head or tail of the snake wins the game. Students should enter the winner (Heads or Tails) on the class tally chart as a data collection exercise. Class discussion should focus on analyzing the data to determine if the game is fair or not. Directions and gameboard are included in the download. This game was developed by a Monmouth University student for the Probability Fair.
Featured Project: A Penny Flipped Is Science Learned
The Franklin Institute invited students around the world to participate in a penny flipping experiment to commemorate the 300th birthday of Ben Franklin. On Tuesday, January 17, 2006, students were asked to flip a coin 10 times, then enter the results online where students could also view the results from around the world. Visit the Franklin Institute site for specific directions for the experiment and to download practice worksheets. The site also lists additional links for more information on coins and probability.
- Visit the Franklin Institute
 A Penny Flipped Is Science Learned web page.

Link: Penny Flipping Game
Students each flip coins and alternate calling "heads" or "tails." The winner places the penny on his/her ten-frame mat. When one partner fills his/her ten-frame, that partner exchanges the ten pennies for a dime and the game starts over. The first player to get three dimes wins the game.
- See directions for the Penny-Flipping Game
- Download Ten Frame Mat